Sea Level Rise and Its Impact
Introduction
Florida has low-lying topography and has developed long coastal line (more than 1,200 miles), which results in making the State more vulnerable to the effects of sea level rise (SLR) and need to promote and execute SLR adaptation planning. Approximately 75% of Floridan (19.5 million population) live in coastal counties1 that generate 79% of the state’s total annual economy2.
According to the National Oceanic and Atmospheric Administration (NOAA), sea level rise began accelerating in Florida 30 years ago. In 2006, the rate significantly increased again as sea levels rose by more than a third of an inch annually- along with certain parts of the Floridian coast. Based on a 2010 report by the Florida Oceans and Coastal Council (FOCC)2, the rapid rate of sea-level rise could lead to 25 times more flooding capable of causing “significant risks to life and property.” The report also states that “Virtually none of Florida’s infrastructure was built to accommodate significant sea level rise. Much of the current infrastructure of coastal Florida will need to be replaced or improved as sea level rises.” As a result, Florida’s historic properties face potential degradation or destruction.
The history of St. Augustine, Florida, “the oldest, continuously occupied settlement of European origin in the continental United States”, began in 1565 when it was founded by the Spanish admiral, Pedro Menéndez de Avilés. The Spanish Crown issued Menéndez expansive privileges to exploit the lands in the vast territory of Spanish Florida, called La Florida by the Spaniards. This contract directed Menéndez to explore the region's Atlantic coast and report on its features, with the object of finding a suitable location to establish a permanent colony. St. Augustine is a low-lying city, crisscrossed by waterways. Along with the SLR trend and recent hurricanes that became more frequent and intense, the City of St. Augustine has faced the vulnerability of many historic properties over the past four decades.
Sea Level Trends
Global sea level has risen about 8 inches over the last century, and is rising about 4 inches since 1993, according to NASA’s satellite sea level observations3, as shown in the Fig-1 and 2. Its rising rate has increased over the last twenty years. It is estimated to rise an additional 12 to 48 inches by 21004.
When we consider global warming, we often hear the term, sea level rise. In this case, SLR refers to “Global” SLR, which is a planetary average. In the sense that sea level rise is not globally uniform across the planet but varies regionally, we need to take a close look at the SLR specific to the local scale. Some locations are showing greater rates of SLR than the global average, while others are showing lower. The differences are related to geographical features, ocean currents, wind patterns, etc. Throughout this article, SLR refers to “Local or Relative” SLR specific to St. Augustine, Florida.
_________________________
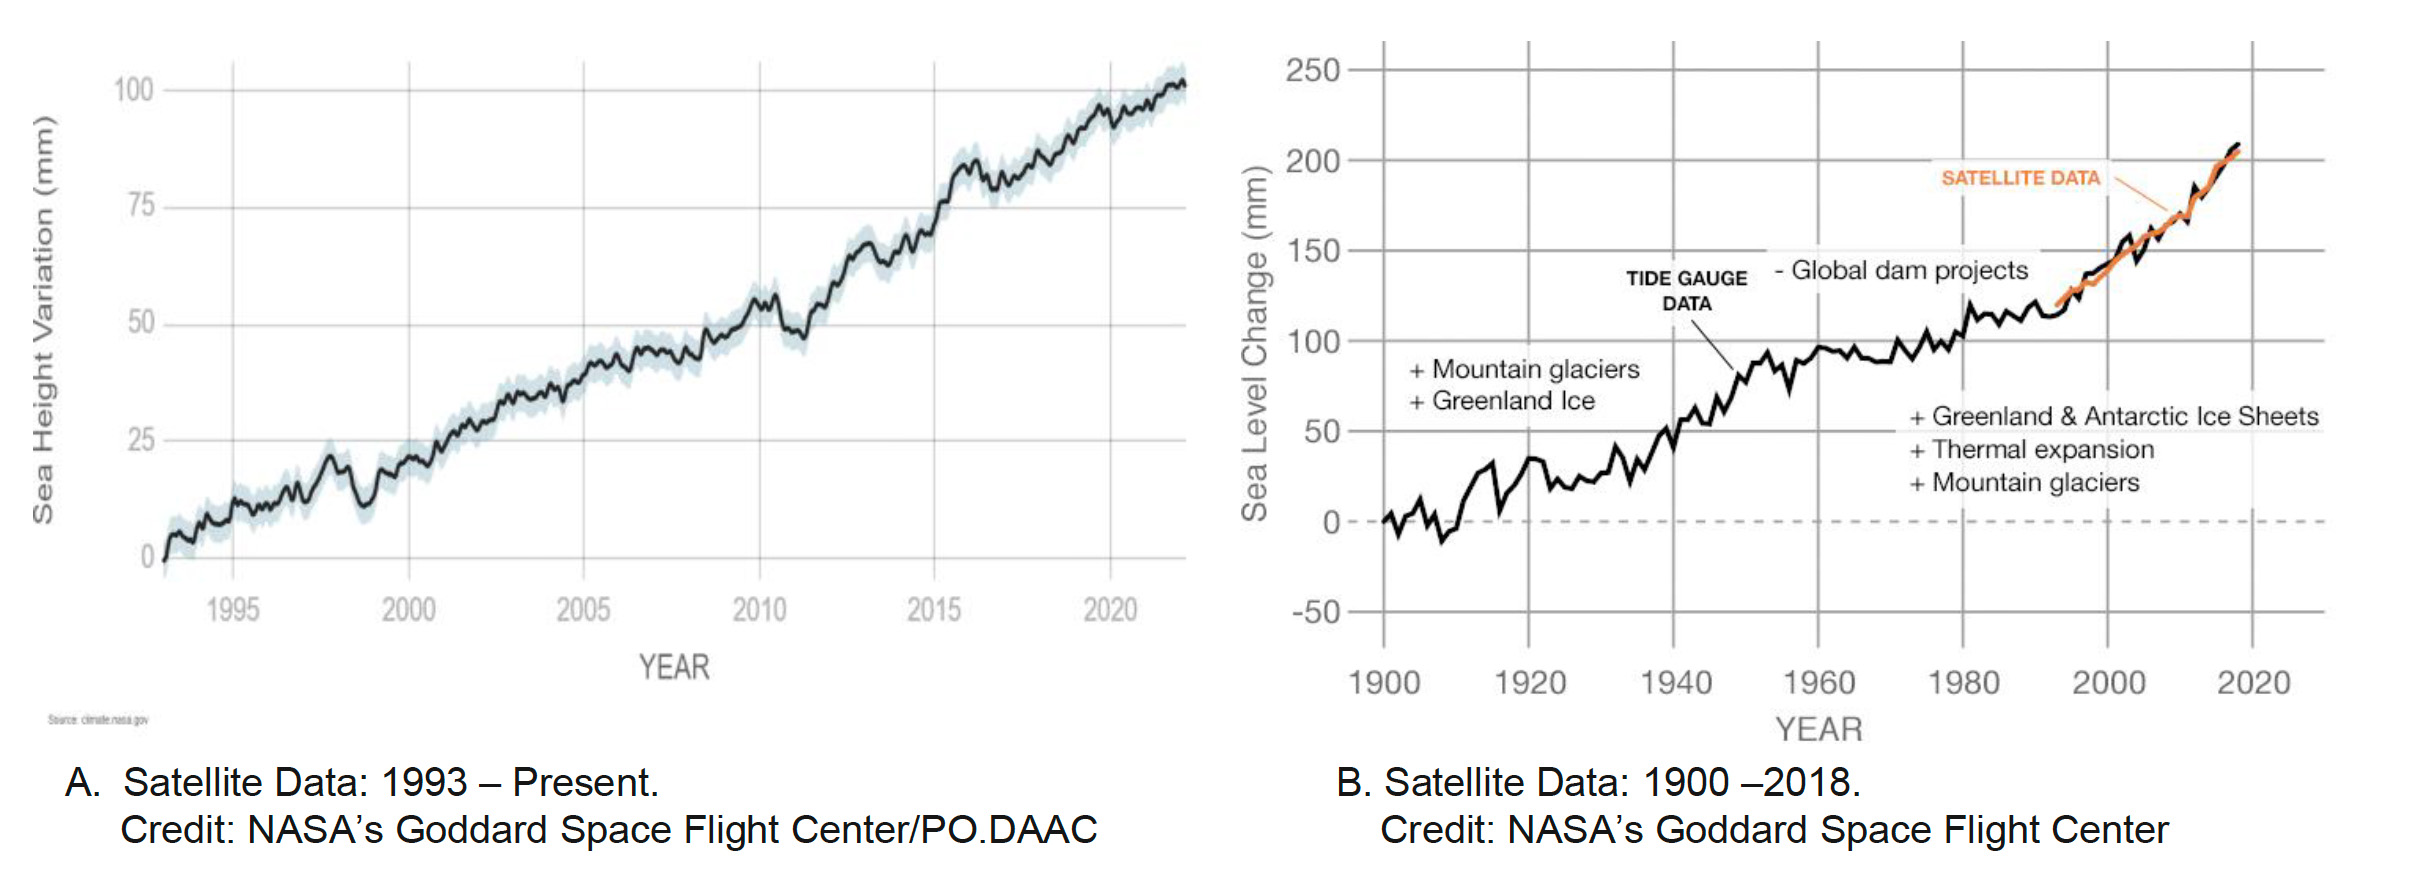 Figure 1. Sea level trends from 1990 to present1.
SLR is caused primarily by the added water from melting ice sheets and glaciers and the thermal expansion of seawater as it warms. The Earth’s oceans absorb approximately 90% of the heat trapped by excess greenhouse gases in the atmosphere. About 40% of the historically observed sea level rise (SLR) can be attributed to thermal expansion from ocean warming, while 60% can be attributed to glacial and ice sheet melt5. Because City of St. Augustine is a low-lying coastal city, it is particularly vulnerable to the impact of SLR. There are two tide stations existed near St. Augustine: Fernandina Beach and Mayport. The Fernandina Beach tide gauge records show SLR of about 8 inches in the last 100 years (0.81 inches per decade)6, which is similar to the global trend, while the Mayport rate is about 20% higher (0.98 inches per decade)7.
SLR Projections
SLR projections are suggested based on reports from NOAA, FLDEO, a Sea-Grant study
by the University of Florida, and Climate Central. Sea level trends are used with
models of future SLR scenarios to estimate what sea levels might be at a given point
in the future. The trends are overlaid with sets of future sea level projections for
evaluation and mapping, such as the US Army Corps of Engineers (USACE) and the National
Climate Assessment, commonly referred to as the NOAA projections.
Research has used a bathtub method for mapping SLR on top of high tide (Mean Higher
High Water (MHHW) – tidal datum) with a Digital Elevation Model (DEM), generated from
laser-based Lidar data, to identify low-lying areas.
Florida Department of Economic Opportunity (FLDEO) released a Coastal Vulnerability
Assessment for the City of St. Augustine, Florida in 2016. Based on this report, presented
in Table-1, SLR is predicted as 0.4 to 0.9 feet for short-term (2045) and 0.7 to 5.2
feet for long-term (2085). “Low scenario” represents a continuation of historical
observations, while “High scenario” considers maximum possible glacier and ice sheet
loss by the end of the century. Considering Intermediate-High projection, SLR is one-foot
in 2040 and three feet in 2080s. Similarly, the UF Resilient Community Initiative
used one-foot, three-foot, and five-foot scenarios on top of MHHW in the study titled
Adapting to Rising Tides. A scenario of one-foot of SLR would affect approximately
25% of the City’s area and is projected to occur as early as 2030, or as late as 2070.
A three-foot SLR scenario would affect approximately 42% of the City and is projected
to occur as early as 2070, or as late as 2100. A five-foot SLR scenario would affect
approximately 68% of the City and is projected to occur no earlier than 2085. While
the impacts to the City under this scenario are the greatest, the time frame for potential
impacts is towards the end of this century.
Table 1. SLR projections at Mayport, FL gage based on NOAA/NCA Projections. Increases are in units of feet relative to local mean sea level and calculated from the mid-point of the existing National Tidal Datum Epoch (1992). (Source: FLDEO8)
| Time Horizon | Low | Intermediate-Low | Intermediate-High | High |
| Short term (2045) | 0.4 ft | 0.7 ft | 1.2 ft | 1.9 ft |
| Long-term (2085) | 0.7 ft | 1.5 ft | 3.2 ft | 5.2 ft |
In general, we consider three types in coastal flood events: MHHW, nuisance flooding,
and the 1% annual chance floodplain. The coastal flood hazard events are projected
by increasing the present-day base surface elevation through addition of each SLR
scenario increment to the base flood conditions, as presented in Table-2. After applying
SLR projections to each coastal flood event type, inundation and coastal flooding
extents are established for each scenario and flood frequency by intersection the
water surface elevation models with the topographic elevation models in a Geographic
Information System (GIS)6. Simply, MHHW is the current water elevation, nuisance flooding
is the water level possible to reach occasionally due to tides and small coastal storms,
and 1% annual chance floodplain is the worst case possible to occur once 100 years.
Table 2. Sources of flood hazard types selected for the St. Augustine vulnerability assessment6.
| Flood Type | Description | Frequency | Water Elevation | Source |
| Mean Higher High Water (MHHW) | The higher daily high tide elevation, defining the limit of what land is essentially “inundated” or has very limited use. | Daily | ~ 2 ft NAVD88 | NOAA VDatum software |
| Nuisance Flooding | Areas frequently flooded by tides and/or small coastal storms. Results in shallow flooding, which may disrupt or limit use. | 12-17 times a year | 3.75 ft NAVD88 | Tidal gauge analysis and coordination with community |
| 1% Annual Chance Flood Event | Areas subject to flooding by significant coastal storms. Defines the Special Flood Hazard Area as delineated on Federal Emergency Management Agency Flood Insurance Rate Maps. Also known as the “Base Flood”. | ~26% chance in 30 years | Range from 6-10 ft | Preliminary FEMA FIS update for St. Johns County, FL. |
Based on the UF study, presented in Table-3 and Fig- 2, 25% of the City can be inundated with 1-foot of SLR above MHHW, which can occur as early as 2030, or as late as 2070. When SLR reaches 3 feet, 42% of the City can be inundated as early as 2070, or as late as 2100. When SLR is 5 feet, it impacts 69% of the City, which can occur no earlier than 2085.
Table 3. Area of City Impacted for Three (Relative) SLR Scenarios Over MHHW9.
| RSLR Above MHHW | Time Frame | City Area | Area Inundated | ||
| (Feet) | (Year) | (Acres)* | (Acres) | (Sq. Miles) | (% of City) |
| Mean Higher High Water (MHHW) | 2030 – 2070 | 5,362 | 1,353 | 2.11 | 25.22% |
| 3.0 | 2070 – 2100+ | 5,362 | 2,260 | 3.53 | 42.15% |
| 5.0 | 2085 – 2100+ | 5,362 | 3,672 | 5.74 | 68.48% |
*Total City Acres of 5,362 or 8.38 square miles were used for the analyses.
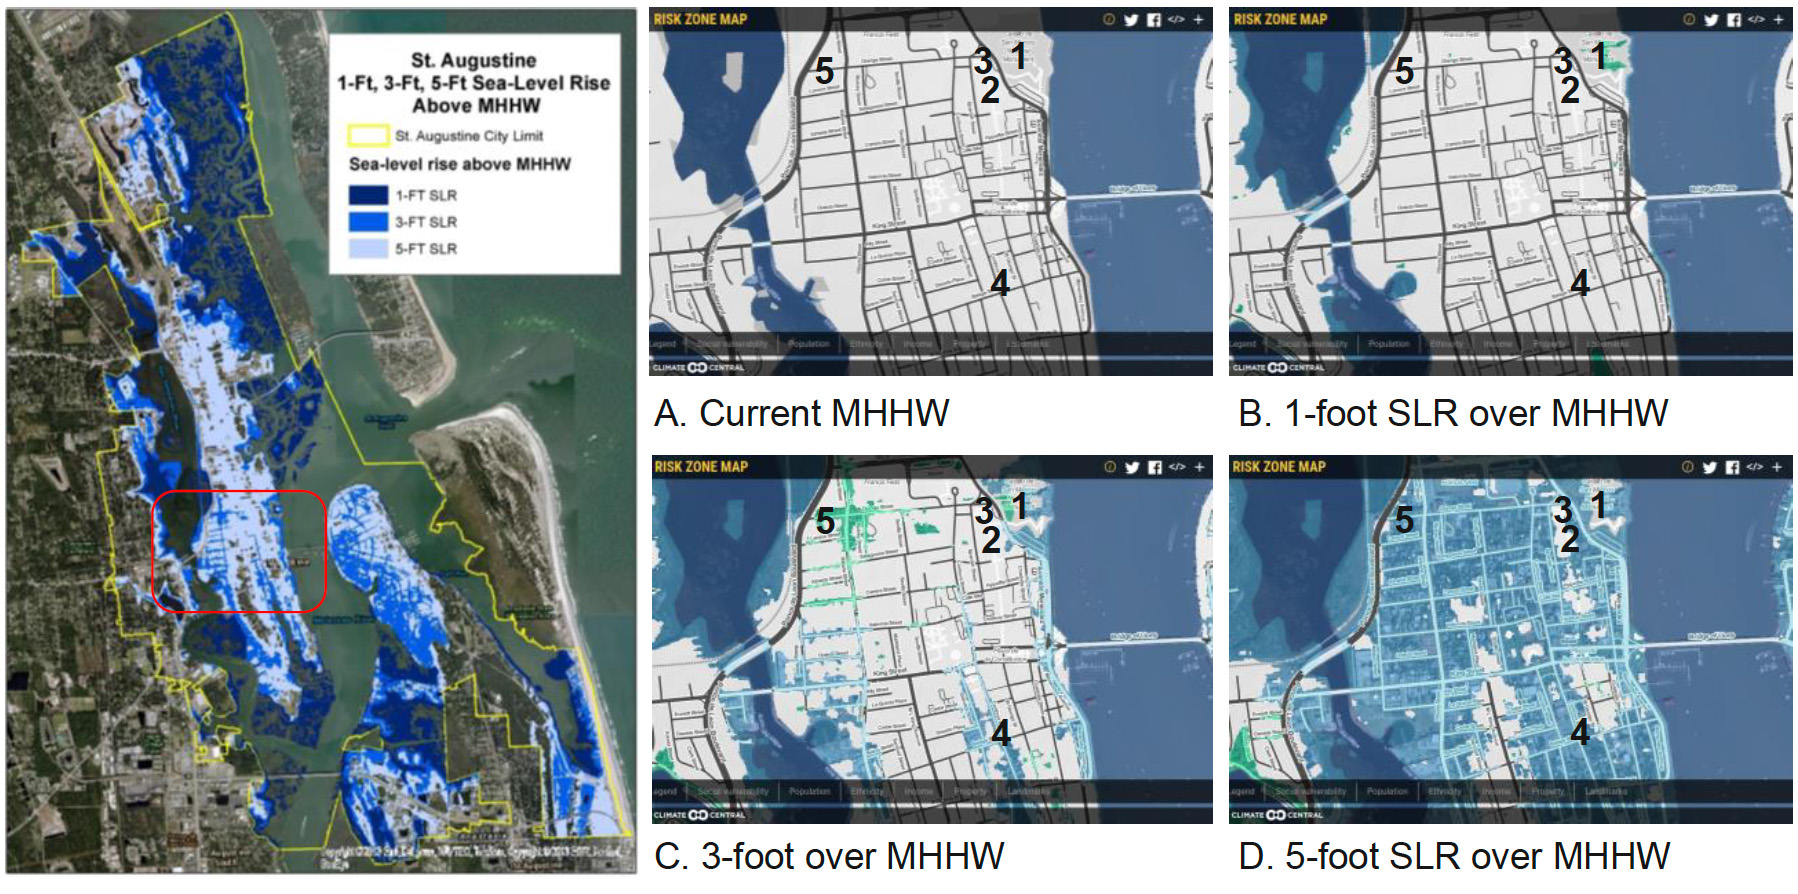 Figure 2. One-foot, three-foot, and five-foot SLR scenarios over MHHW in the City
of St. Augustine7. Figures A to D, generated using Climate Center’s Surging Sea Risk Zone Map, show
the focus areas containing (1) Castillo de San Marcos, (2) Oldest Wooden School House,
(3) Old City Gate, (4) Cordova St., and (5) Orange St.
Figure 2. One-foot, three-foot, and five-foot SLR scenarios over MHHW in the City
of St. Augustine7. Figures A to D, generated using Climate Center’s Surging Sea Risk Zone Map, show
the focus areas containing (1) Castillo de San Marcos, (2) Oldest Wooden School House,
(3) Old City Gate, (4) Cordova St., and (5) Orange St.
Particularly, Salt March areas have a significant impact even from the one-foot SLR projection. It is projected that 60% of Salt March can be sunk with the one-foot SLR projection. In the sense that these salt marches provide critical ecosystem services for the area, it may diminish the protective storm surge buffering function they currently serve after 2030. Furthermore, approximately 922 and 2,291 historic structures among 3,288 are potentially affected by three-foot and five-foot SLR respectively, while four private historic structures are impacted by one-foot SLR.
Storm Surge Effects
Storm surge can be considered as the case of a 1% annual chance floodplain and is
often the greatest threat to life and property along the coast from a hurricane. A
problem is that hurricane gets more often and becomes stronger over the past four
decades. Storm surge is an abnormal rise of water generated by a storm, over and above
the predicted astronomical tides. It is defined as the water level rise due to the
combination of storm surge and the tide. The rise in water level can cause extreme
flooding in coastal areas particularly when storm surge coincides with normal high
tide, resulting in storm tides reaching up to 20 feet or more in some cases10. Follow the link for more information: https://youtu.be/ESchgv-JCGg)
Storms are divided into different categories, representing three feet of water surge for Category 1, and up to 9 feet of water surge for Category 3 in the St. Augustine area (Source: NOAA). The maps below, Fig-3, show the potential water levels caused by Category 1-3 Hurricanes. Storm surge from the Cat-2 hurricane potentially impacts most of the historic structures in the City with greater than 3 feet of water level above ground.
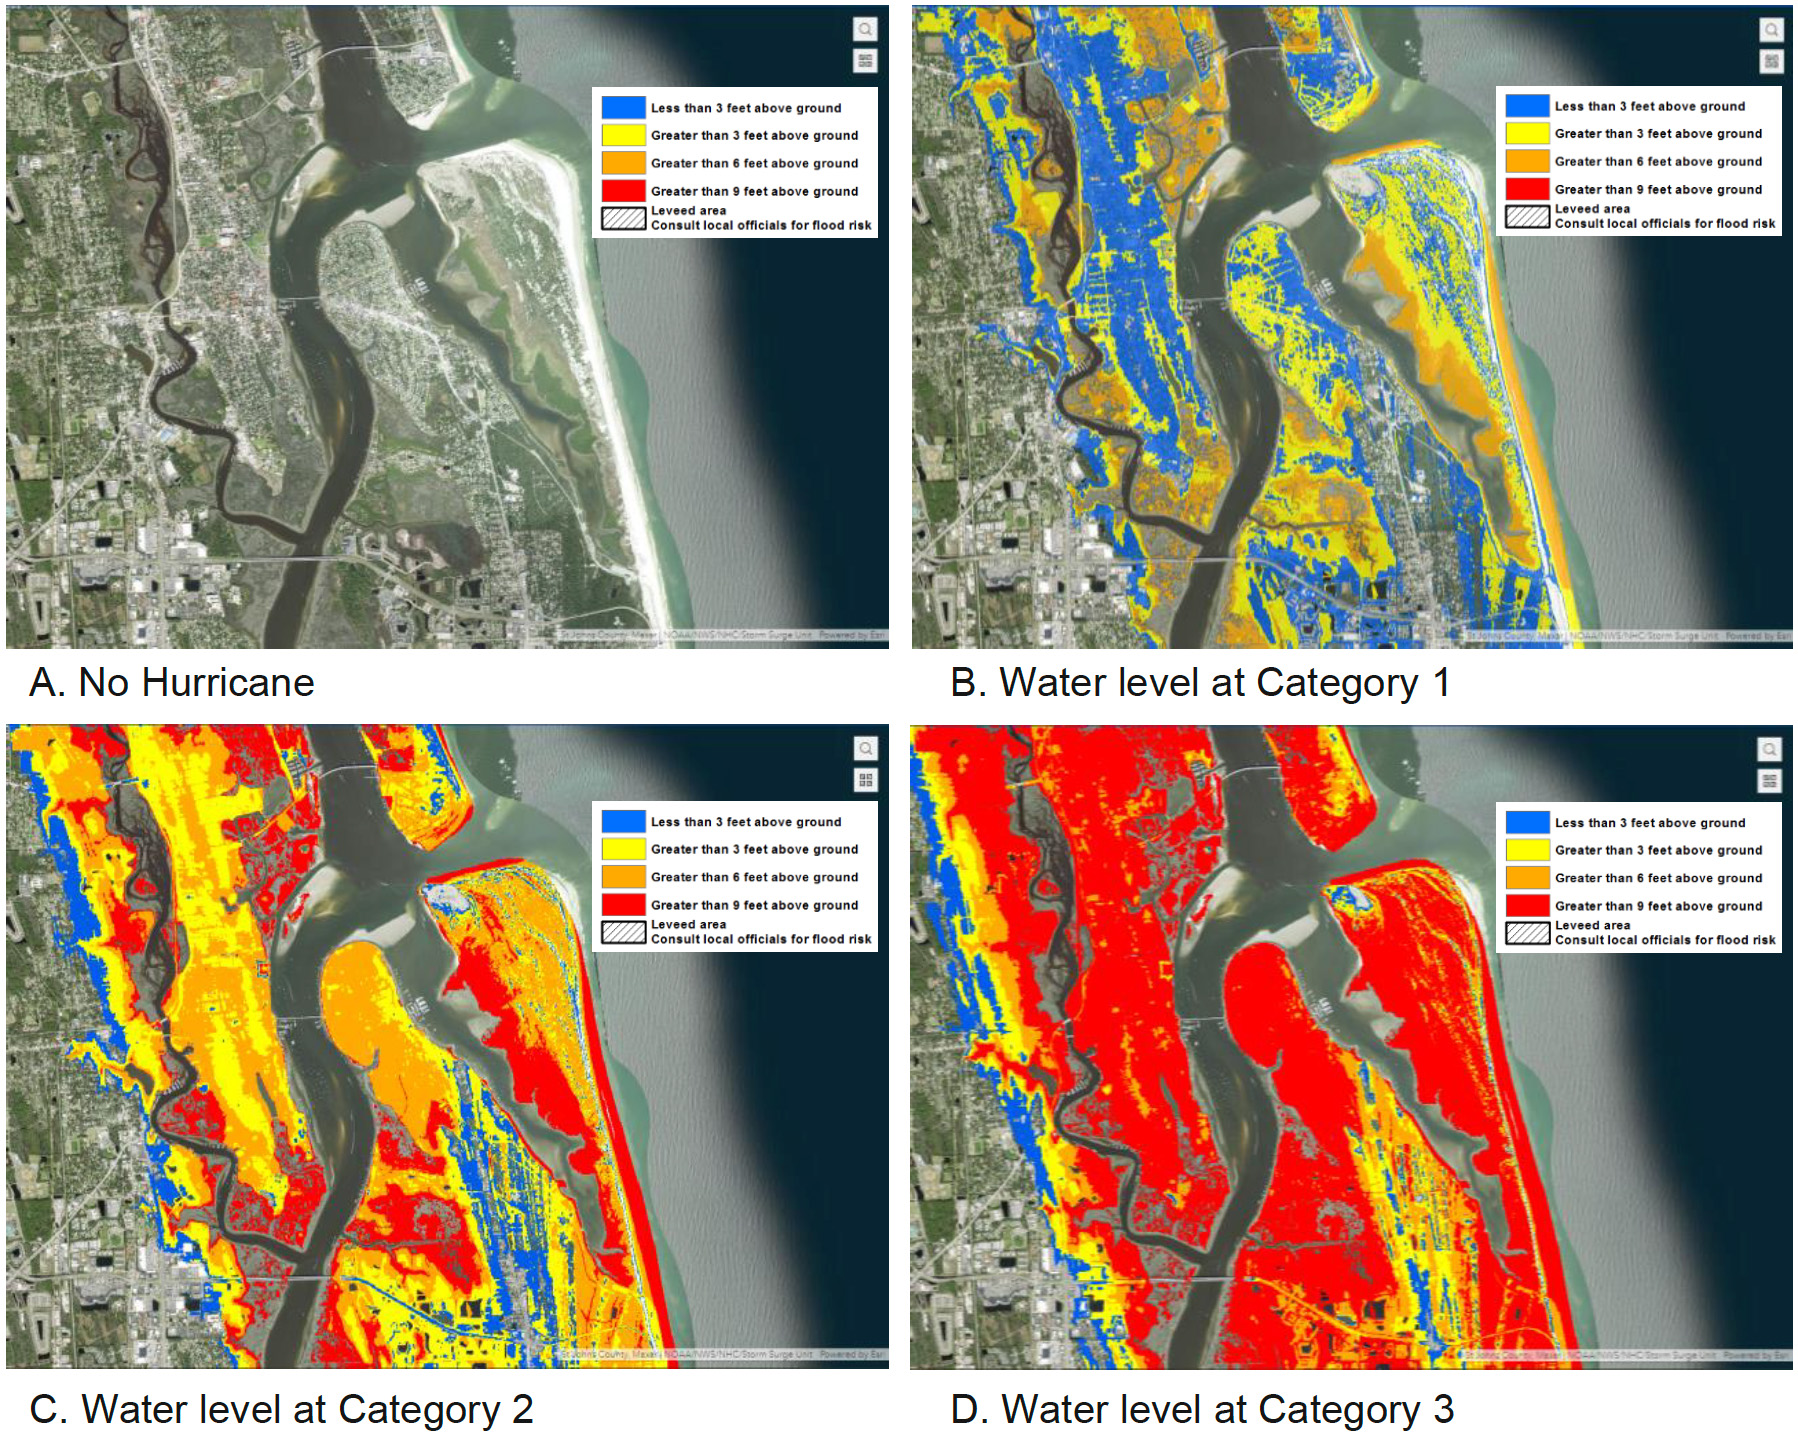 Figure 3. Storm surge water level maps projected from Category 1 to 3 hurricanes for
St. Augustine8
Figure 3. Storm surge water level maps projected from Category 1 to 3 hurricanes for
St. Augustine8
Adaptation Strategies
General adaptation strategies, based on the IPCC 2019 report, are 1) Projection, 2)
Accommodation, 3) Advance, 4) Retreat, and 5) Ecosystem-based adaptation (EbA)11, as presented in Table-4 and Fig-4. Protection strategies are applicable to valued
assets with significant location-dependence, which are unsuitable for infrastructure
alteration or relocation. Hard protection (e.g., dikes, seawalls, breakwaters, barriers
and barrages) and advance (building into the sea) are economically efficient in most
urban context facing land scarcity, but can lead to increased exposure in the long
term. Where sufficient space is available, EbA can both reduce coastal risks and provide
multiple other benefits. Accommodation strategies, such as flood proofing buildings
are applicable to valued assets which are suitable to alteration to reach sufficient
elevation thresholds to avoid scenario-based inundation risks. Advance strategies
create new land by building seaward, reducing coastal risks for the hinterland and
the newly elevated land. Retreat strategies, such as voluntary setbacks and easements,
are applicable to extendable assets with higher vulnerability to SLR and coastal hazards.
EbA strategies provide a combination of protect and advance benefits based on the
sustainable management, conservation and restoration of ecosystems, such as wetlands
and reefs.
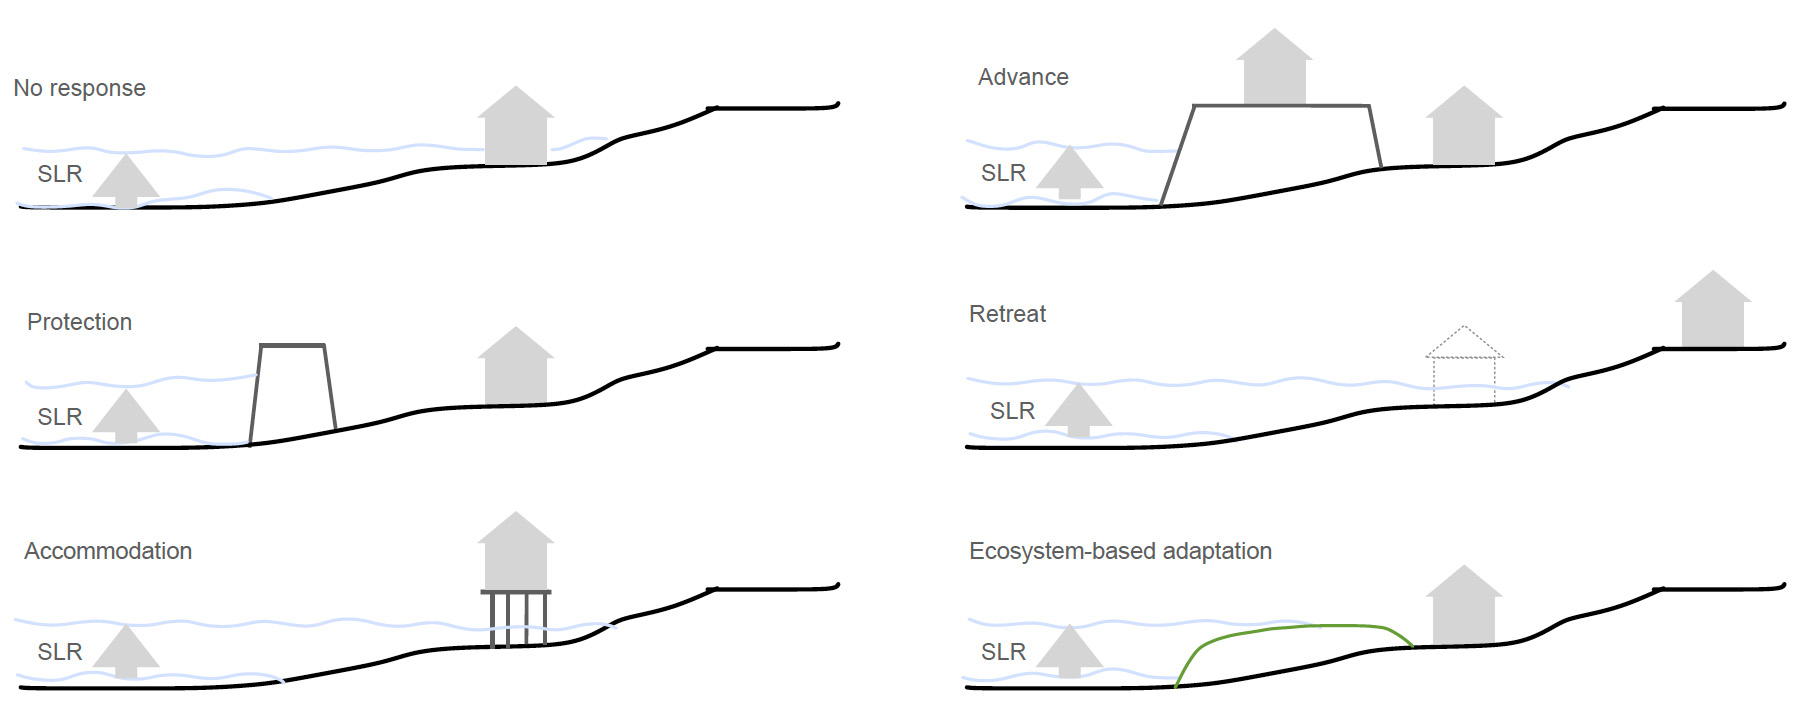 Figure 4. Different types of strategies responding to coastal risk and SLR (created
based on the Figure 1 of the IPCC 2019 report9).
Figure 4. Different types of strategies responding to coastal risk and SLR (created
based on the Figure 1 of the IPCC 2019 report9).
Discussion
Climate-change induced Global SLR is caused by ocean mass gain from in land-ice mass
and thermal expansion of ocean water. Responses to SLR refer to legislation, plans
and actions undertaken to reduce risk and build resilience. These responses range
from protecting the coast, accommodating SLR impacts, retreating from the coast, advancing
into the ocean by building seawards and EbA. We need to assess their effectiveness,
technical limits, costs, benefits, and the specific governance challenges. A variety
of adaptation responses to coastal impacts and risks have been implemented around
the world, but mostly as a reaction to current coastal risk or experienced disasters.
Economic challenges to the adaptation strategies increase with higher sea levels and
make adaptation unaffordable before technical limits are reached. Thus, intergovernmental
coordination, cooperation and collaboration are the key for the adaptation strategies:
time horizon and uncertainty; cross-scale and cross-domain coordination; equity and
social vulnerability; social conflict; and complexity9. Vulnerability assessments,
community outreach and education can raise awareness of the SLR impacts and strategic
implementation of the adaptation is required with planning, regulatory, financial
support, etc. Furthermore, sharing best practices to implement SLR responses and lessons
learned from practical efforts synthesize its success.
1 Wilson, Steven G. and Thomas R. Fischetti. (May 2010). Coastline Population Trends
in the United States: 1960 to 2008. Current Population Reports. U.S. Census Bureau.
p. 4. https://www.census.gov/prod/2010pubs/p25-1139.pdf
2 Florida Oceans and Coastal Council. (December 2010). Climate Change and Sea-Level
Rise in Florida: An Update of the Effects of Climate Change on Florida’s Ocean & Coastal
Resources. pp. 1-2. http://www.dep.state.fl.us/oceanscouncil/reports/
3 NASA’s Goddard Space Flight Center. https://climate.nasa.gov/vital-signs/sea-level/
4 Melillo, Jerry M., Terese (T.C.) Richmond, and Gary W. Yohe, Eds. 2014: Climate Change
Impacts in the United States: The Third National Climate Assessment. U.S. Global Change
Research Program, 841 pp. doi:10.7930/J0Z31WJ2. https://www.nrc.gov/docs/ML1412/ML14129A233.pdf
5 Mean Sea Level Trend. Tide Gauge 8720030: Fernandina Beach, FL. (NOAA). http://tidesandcurrents.noaa.gov/sltrends/sltrends_station.shtml?stnid=8720030
6 Mean Sea Level Trend. Tide Gauge 8720218: Mayport, FL. (NOAA). http://tidesandcurrents.noaa.gov/sltrends/sltrends_station.shtml?stnid=8720218
7 Florida Department of Economic Opportunity (FLDEO), Coastal Vulnerability Assessment:
City of St. Augustine, Florida, Table 2, Table 4, Page 9, 2016
8 University of Florida Resilient Communities Initiative, Adapting to Rising Tides
(Coastal Resilience in St. Augustine: Baseline of Our Past, Beacon for Our Future),
Table-2, Figure-2, 2016
9 National Hurricane Center and Central Pacific Hurricane Center, Storm Surge Overview
and Strom Surge Risk Maps, https://www.nhc.noaa.gov/surge/
10 H.-O. Pörtner,. D.C. Roberts, V. Masson-Delmotte, P. Zhai, M. Tignor, E., IPCC Special
Report on the Ocean and Cryosphere in a Changing Climate, Chapter 4, IPCC, 2019. https://www.ipcc.ch/site/assets/uploads/sites/3/2019/12/SROCC_FullReport_FINAL.pdf